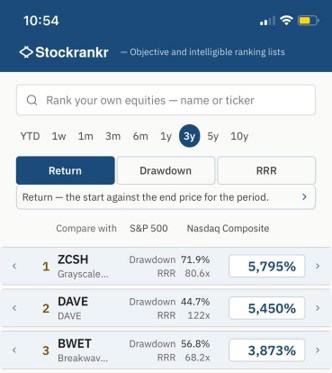
People rank everything. Except stocks.
We are on a mission to make stock rankings objective and verifiable
Objective ranking lists, by return, drawdown and risk-return-ratio. Just the basic facts.
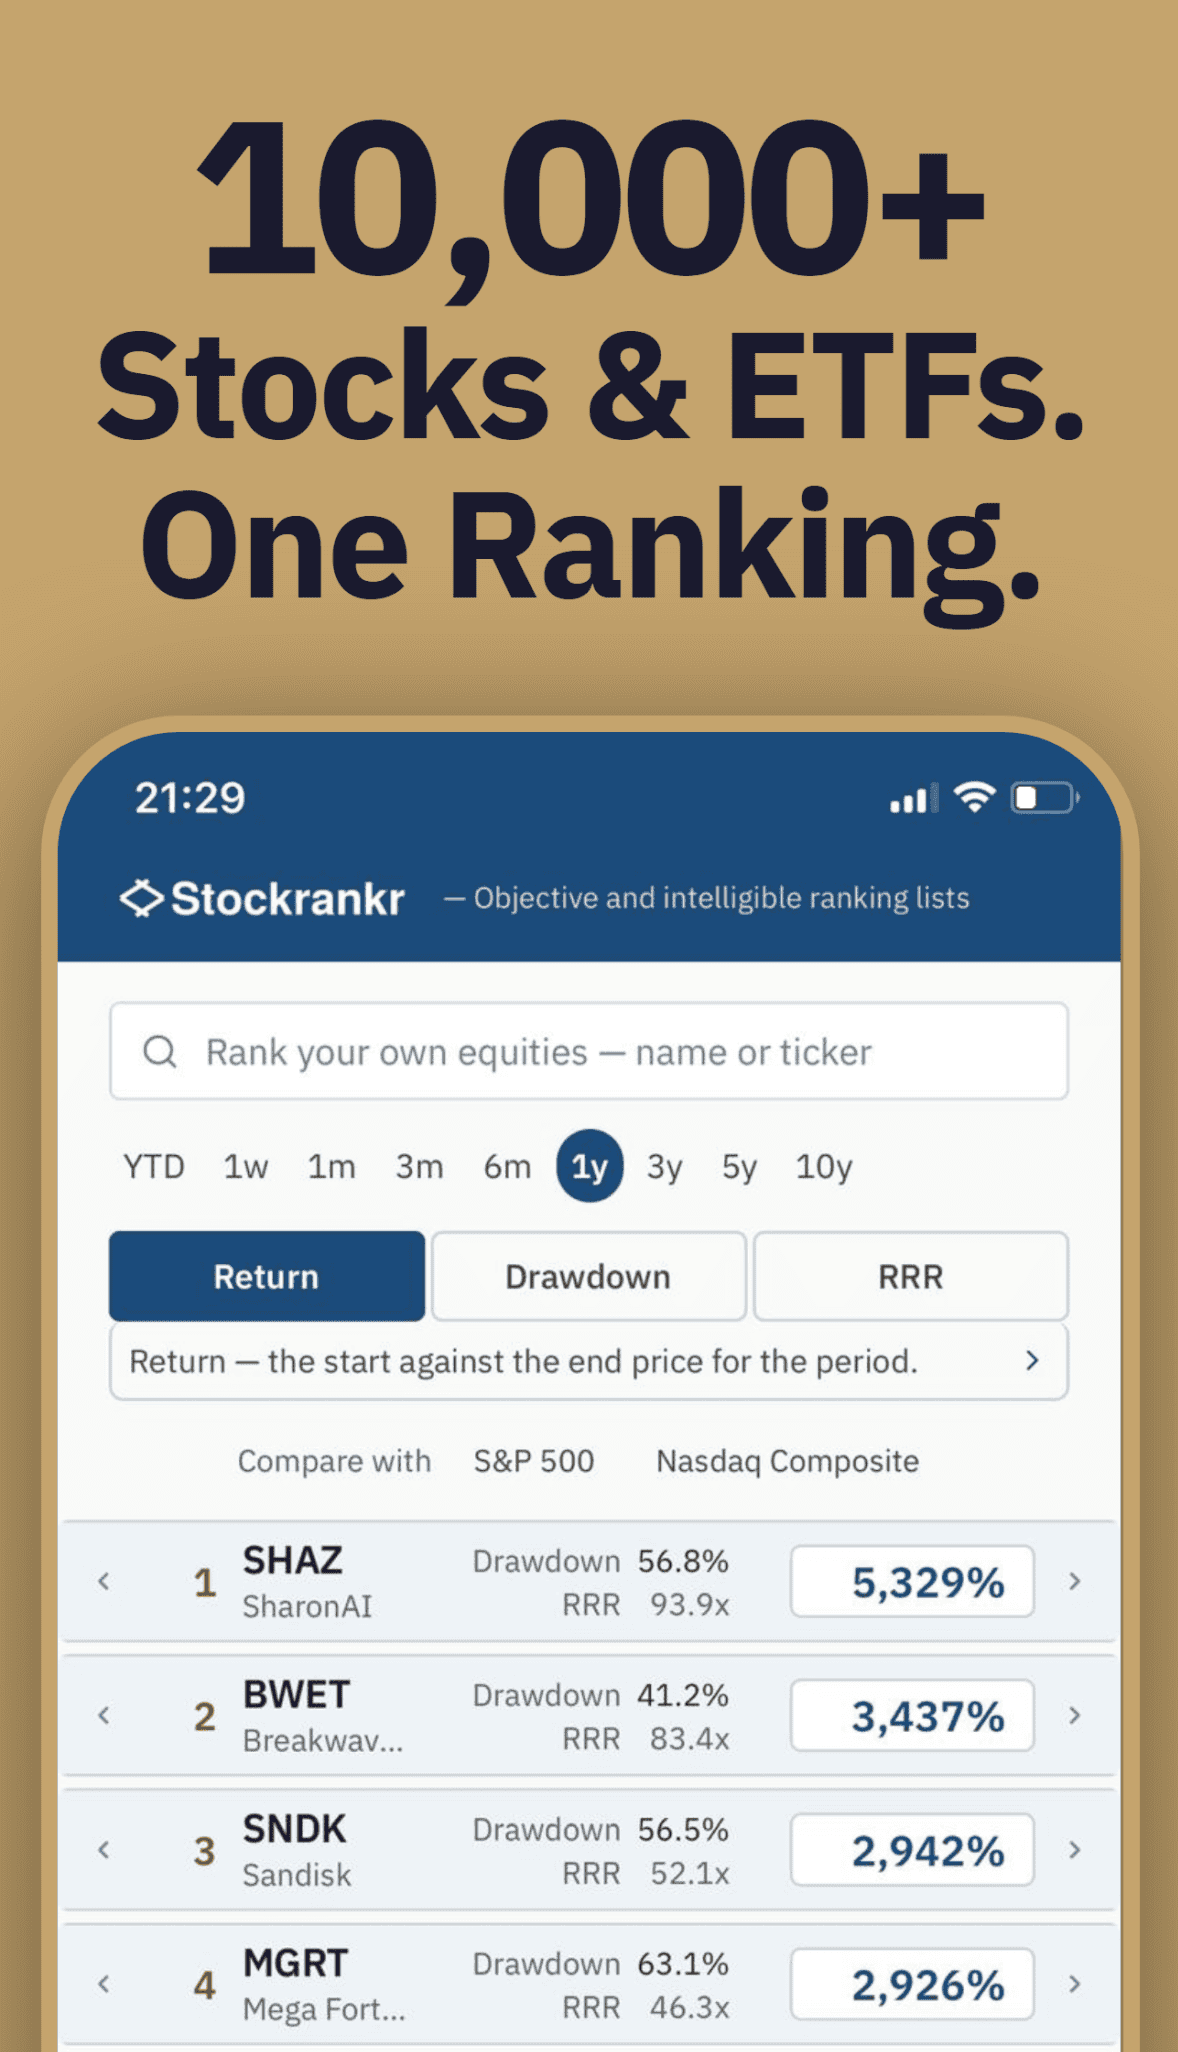
Why ranking lists?
Investing often comes down to two ongoing questions: how are the current investments doing, and what to look at next. Both need the same thing — an up-to-date standing and comparison, just like a ranking list.
Ranking lists are used everywhere, like in sports, to find the current standings and comparison.
Why objective rankings?
Imagine if every sports commentator kept their own private league table — their own weighting, their own impressions. That wouldn’t be a ranking, it’d be an opinion with a scoreboard. Real rankings, in sport or anywhere else, are built on facts: wins, times, scores. Stockrankr applies the same idea to stocks and ETFs — rank first by what actually happened, the objective facts, across the board.
Why drawdown focus?
Investing carries two kinds of risk: missing out on a gain, and losing money you already have. The first stings but costs you nothing. The second is worse — the maths works against you, too: a 50% fall needs a 100% gain just to get back to even. As Warren Buffett put it, the first rule of investing is not to lose money. For reasons like these, we focus on Maximum Drawdown as a measure of risk, and the Risk-Return-Ratio (RRR) as a measure of risk-adjusted returns.
Stockrankr ranks 10,000+ US-listed stocks and ETFs
Everything ranks together in one pass, not in categories, because categorization can easily become a judgment call, not a fact.
The 3 Ranking Lists
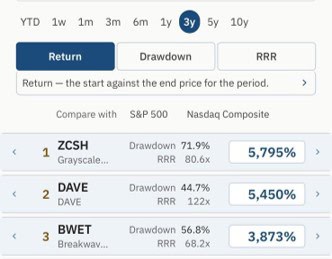
Return
Where the price ended against where it started, over the period you picked.
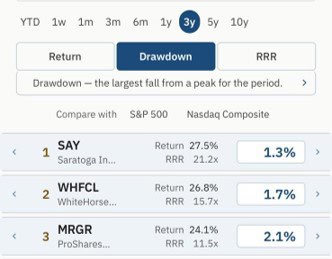
Drawdown
The largest fall from peak to trough during a period. A smaller drawdown is better.
Risk-Return-Ratio
The Risk-Return-Ratio (RRR) is the return divided by that Maximum Drawdown.
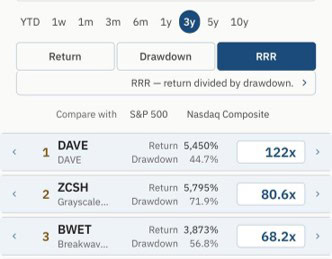
The whole universe of 10,000+ stocks and ETFs is ranked daily. A weekly summary is also provided, so there’s also a considered update to check in on. The RRR formula was first published in 2010 by our founder Dr Richard Johnsson. Anyone can check the maths on Wikipedia — nothing about how a rank is calculated is hidden.
The Stockrankr Matrix™
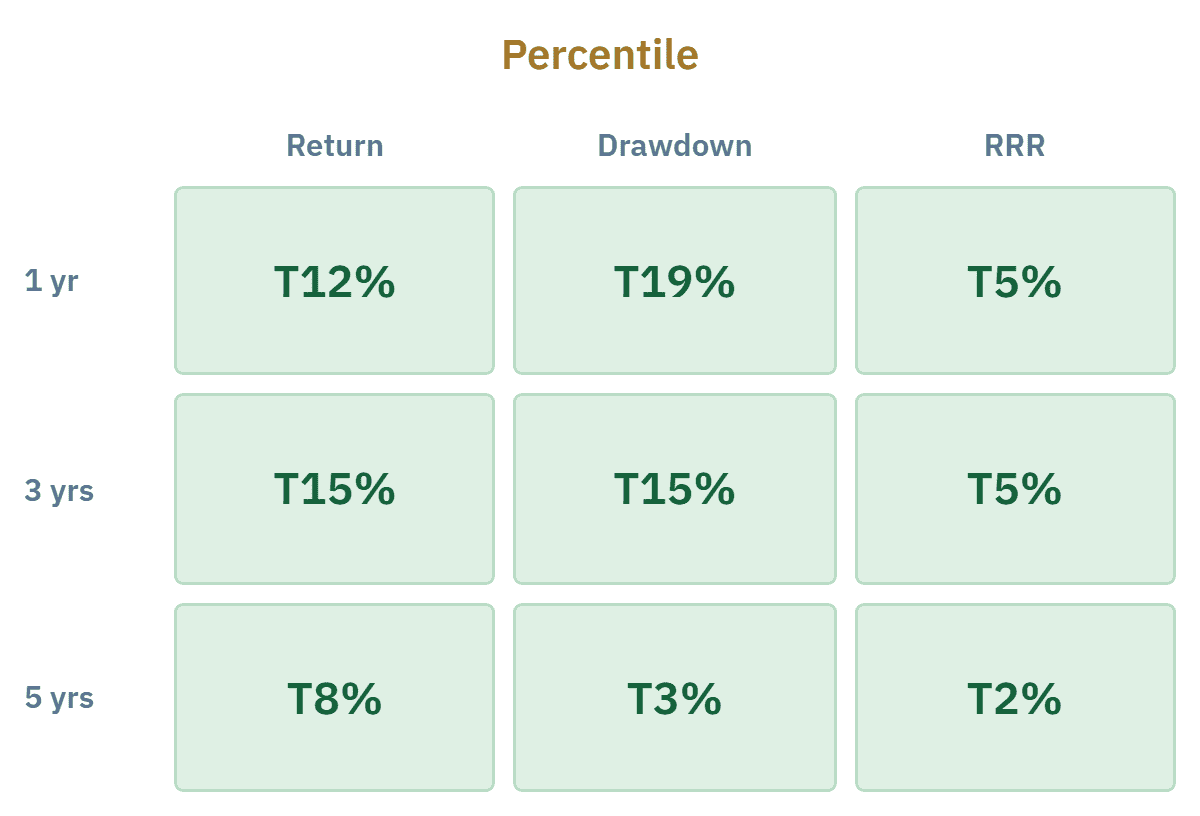
Every stock and ETF we track gets its own Stockrankr Matrix™ — a compact 3×3 grid showing Return, Drawdown and RRR across three timeframes: 1, 3 and 5 years. Green means top 25% of the whole universe on that measure and timeframe. Yellow is the next quarter down. Red is the bottom half. Same objective rule for every cell. T9% just means Top 9% of all ranked equities.
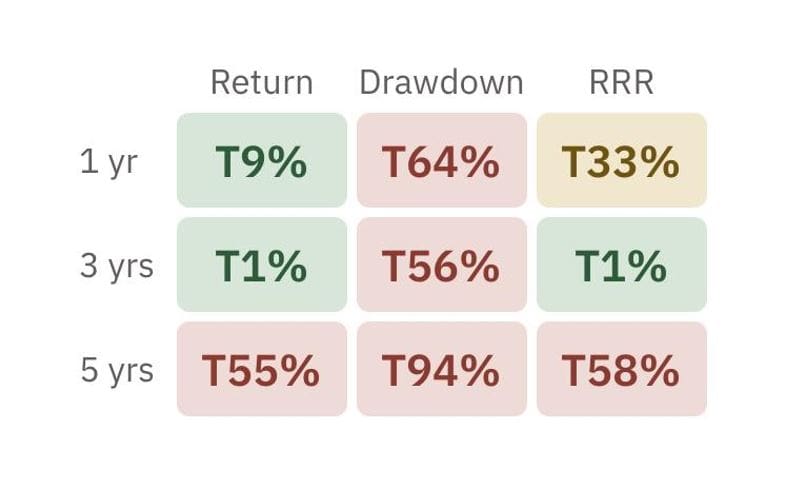
Example – A real world US ETF
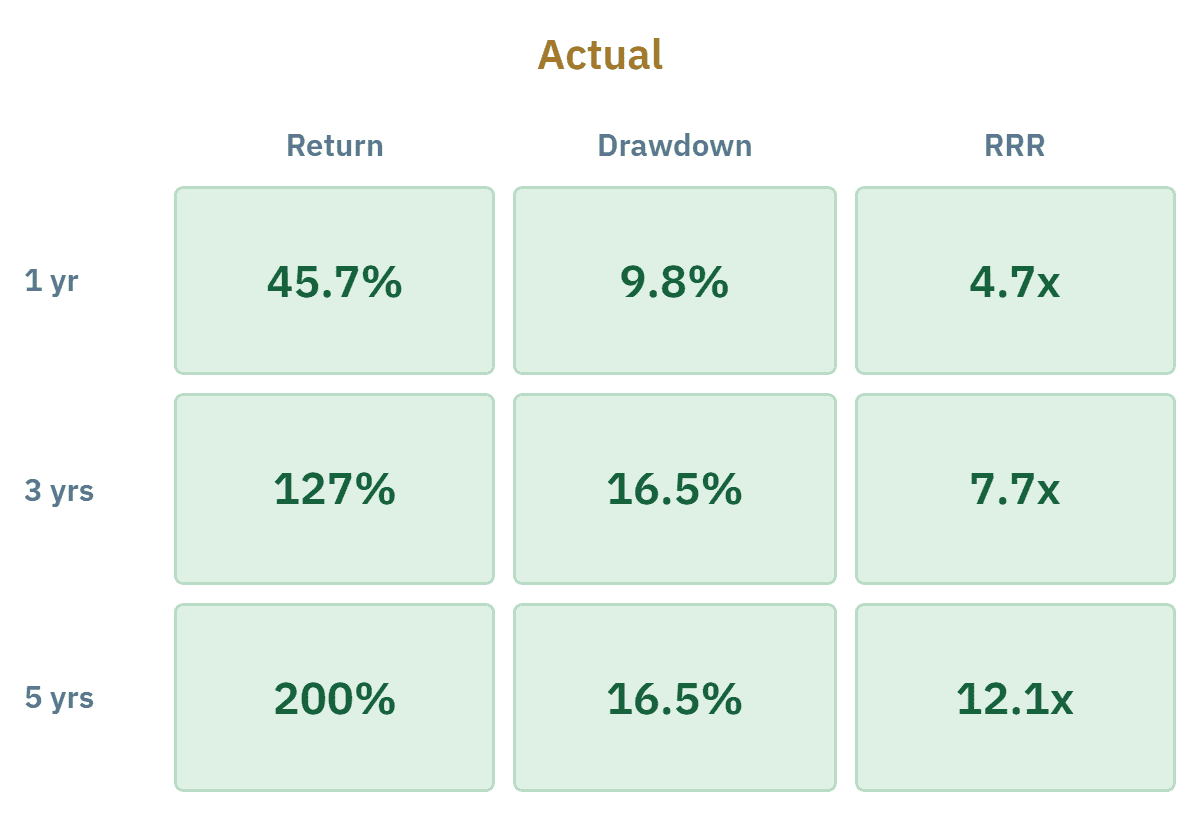
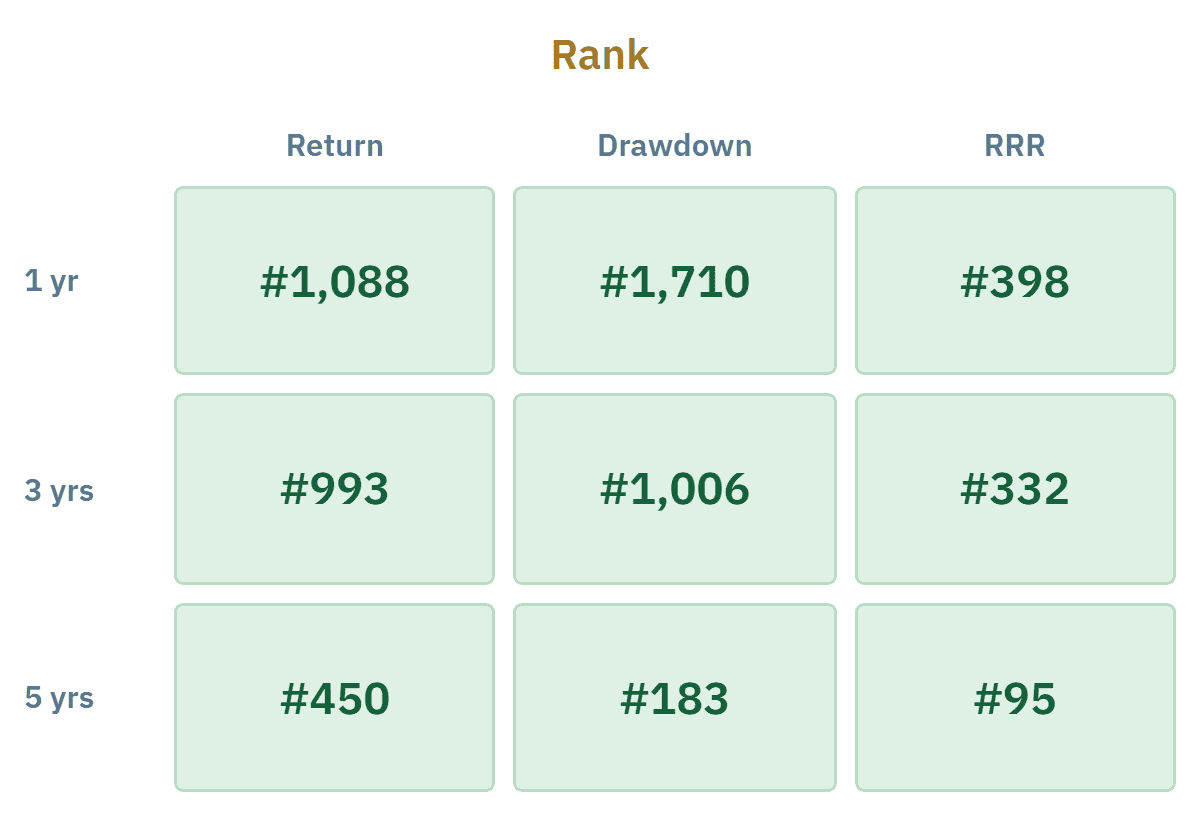
The Stockrankr+ and ++
Stockrankr+ — top 25% on Return, Drawdown and RRR, consistently, across all three timeframes. All nine cells. Roughly 1 in 100 stocks qualify.
Stockrankr++ — the same nine-cell requirement at a stricter bar: top 15% instead of top 25%. Roughly 1 in 10,000 equities qualify.
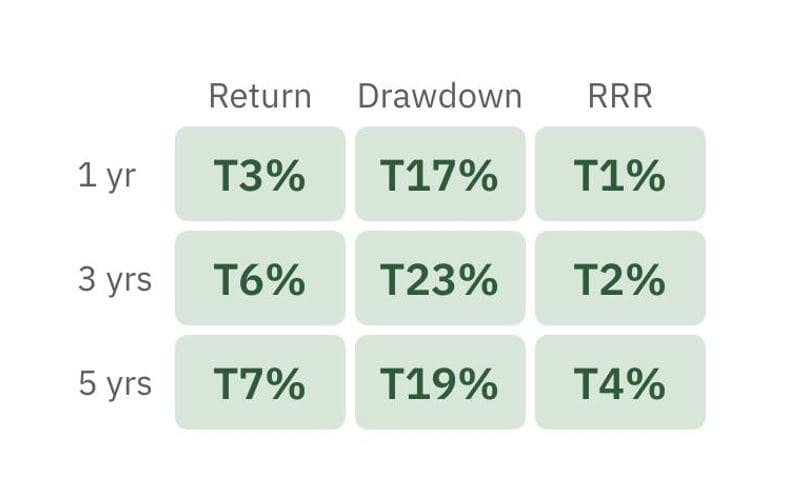
Both the + and ++ marks are entirely mechanical — no judgment call, no analyst opinion, no curation. Just the same formula and threshold, applied identically to every security.
Performing Security Analysis
Benjamin Graham – Warren Buffett’s mentor – is widely recognized as a pioneering figure in security analysis.
He thought the basics of security analysis were about finding the facts and presenting them in a coherent, readily intelligible manner. An organized factual basis for the application of judgment, as he put it. Graham also wrote that “the functions of security analysis may be described under three headings: descriptive, selective and critical.”
Stockrankr gives you the facts, so you can build your own lists at each stage, in the spirit of Graham:

1. Watching — anything you’ve noticed and want to keep an eye on. No commitment, just awareness.
2. Considering — stocks you’re actively comparing, narrowing down a real shortlist.
3. Deep diving — the stocks you’re seriously researching before committing any money.
That’s of course just a suggested process but could be a start.
How people use Stockrankr
Here are a few different ways.
James
He doesn't just take the advisor's word for it. Before agreeing to a new proposal, he checks the stock's full return and risk history himself — is this actually as strong as it's being pitched? He does the same with what he already owns, every few months, so he walks into review meetings with real questions instead of nodding along.

Priya
Cares more about not losing money than about chasing it. She filters straight to the rarest, most consistently top-ranked stocks, checks the full history before considering a position, and treats a low drawdown as more convincing than a strong return ever is on its own.

Chris
Not chasing anything flashy. He's built his own list of stable, boring companies he plans to hold for years, and checks in occasionally to see if anything's changed enough to reconsider.

Aisha
Busy, and fine with that. Sundays, coffee in hand, she reads the weekly summary and closes the app — that's the whole ritual. If a stock she recognises shows up as one of the rare, top-ranked ones, she'll save it to follow later.

Tom
Doesn't trust a number he can't check. Before he believes any ranking, he opens the full breakdown and works through it himself — same formula, same data, same answer he'd get by hand. Once it checks out, he trusts it more than he trusts most financial media.

Marie
A little intimidated by all of it. She opens the main list, starts at #1, and scrolls down, tapping into a stock's details whenever a name catches her eye. No jargon to learn first, no account to set up before she can look.

Rank your stocks and ETFs
Free to start. Pro subscription with free trial available.